Introduction
The Niagara is the simplest, lowest-cost method of improving throughput on an existing ICP or ICP-MS system. Increased throughput is achieved by rinsing the nebulizer and spray chamber the instant the sample measurement is completed and continuing to rinse until the next sample has reached the nebulizer. Thus, the rinse is carried out during the time it takes for the sample and the rinse solutions to flow from the autosampler probe to the nebulizer. The typical time saved with the Niagara is around 30%, and, since the valve switches immediately after the read is complete, the amount of sample introduced to the ICP-MS is minimized. This feature drastically reduces the cost of consumables and the frequency of cleaning, particularly for challenging sample matrices.
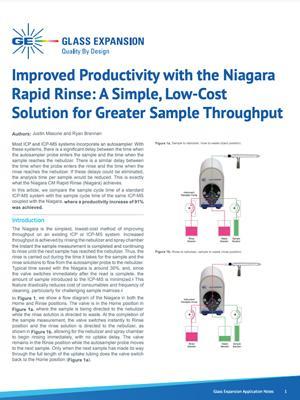
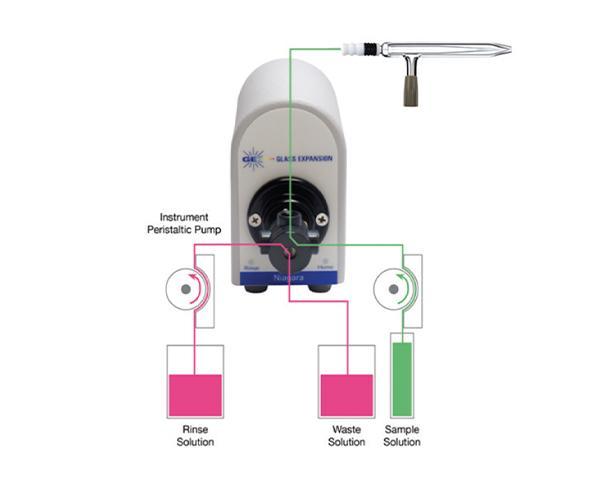
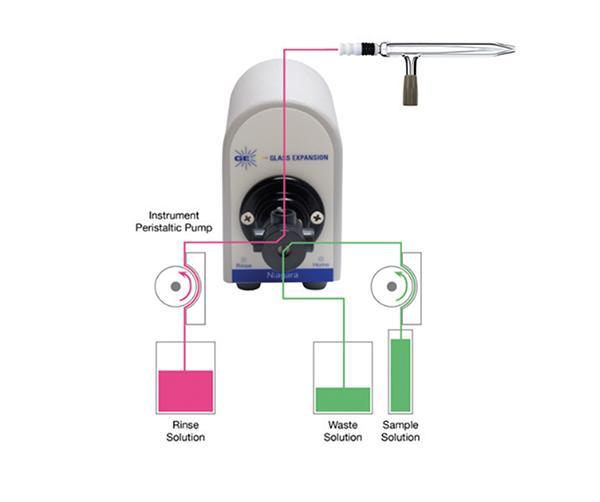
In Figure 1, we show a flow diagram of the Niagara in both the Home and Rinse positions. The valve is in the Home position in Figure 1a, where the sample is being directed to the nebulizer while the rinse solution is directed to waste. At the completion of the sample measurement, the valve switches instantly to the rinse position and the rinse solution is directed to the nebulizer, as shown in Figure 1b, allowing for the nebulizer and spray chamber to begin rinsing immediately, with no uptake delay. The valve remains in the Rinse position while the autosampler probe moves to the next sample. Only when the next sample has made its way through the full length of the uptake tubing does the valve switch back to the Home position (Figure 1a).
In this article, we compare the sample cycle time of a standard ICP-MS system with the sample cycle time of the same ICP-MS coupled with the Niagara, where a productivity increase of 91% was achieved.
Part of the simplicity in installing and optimizing the Niagara Rapid Rinse lies in the software package. The software includes a Method Wizard (Figure 2), which features an Uptake Delay Calculator, Rinse Tubing Calculator, and Time in Sample (TIS) Calculator. The addition of these calculators greatly simplifies method development so that you can quickly add the Niagara to your existing ICP method and optimize for maximum savings.
The Uptake Delay Time is the time required for the sample to reach the valve and pass through to waste, ensuring that the first bit of sample diluted with the previous rinse is flushed out to waste. Once the Uptake Delay Time has finished, the Niagara valve will switch from Rinse to the Home position, directing the sample to the nebulizer. The Uptake Delay Time is calculated based on the ID and length of the autosampler probe; peristaltic pump tubing ID and length; and RPM of the peristaltic pump (Fast Pump Speed).
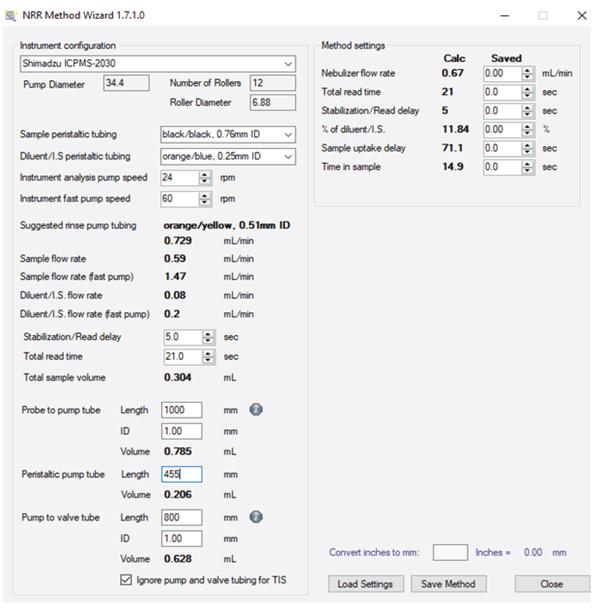
The Rinse Tubing Calculator calculates the optimum peristaltic pump tubing to be used in order to achieve the same flow rate that is used during analysis while using a fast pump during the uptake and post-acquisition rinsing steps of the analysis.
Time in Sample (TIS) is the time required for the autosampler probe to remain in the sample tube during the acquisition. The TIS is based on the total read time, RPM of the peristaltic pump (Analysis Pump Speed), and dimensions of the uptake tubing referenced above.
To improve washout, it is well known that adding a bubble or series of bubbles can help “scrub” the uptake line.1 However, air bubbles introduced into the plasma can lead to instability and require longer stabilization delay times. With the Niagara, we can easily add a series of air bubbles with our post-wash command, without the worry of introducing any air or extra argon into the plasma. To achieve this, the Niagara software sends the autosampler probe to the rinse station after the TIS has been completed, followed by a series of commands to slowly raise and lower the probe in the rinse station.
This creates a series of air gaps between the rinse solution, helping to rinse the probe, uptake tubing, and sample peristaltic pump tubing. Once the ICP method rinse begins, the air bubbles and any excess sample are directed to waste, while the rinse solution is directed to the nebulizer.
Results
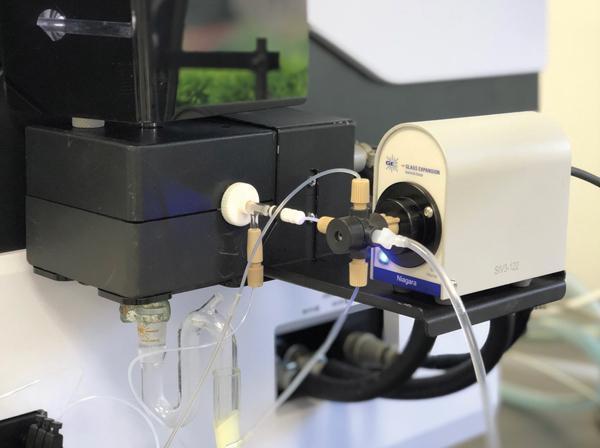
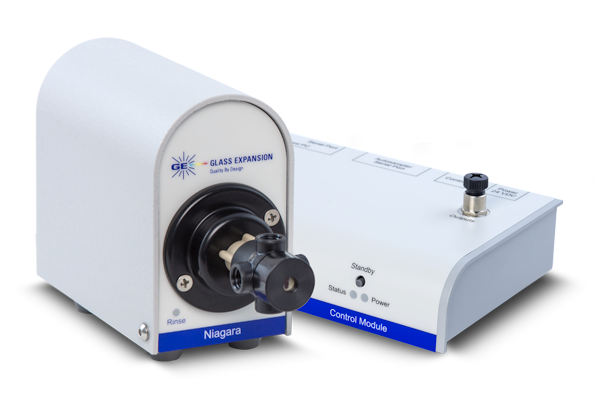
A Shimadzu® ICPMS-2030 with a Shimadzu® AS-10 autosampler was used for this study. The standard sample introduction system includes a MicroMist™ nebulizer (0.6 mL/min), a Twister™ spray chamber, and a quartz mini torch, all supplied by Glass Expansion. The Niagara Rapid Rinse accessory was installed using a custom bracket, in order to position the valve as close to the nebulizer as possible, as seen in Figure 3.
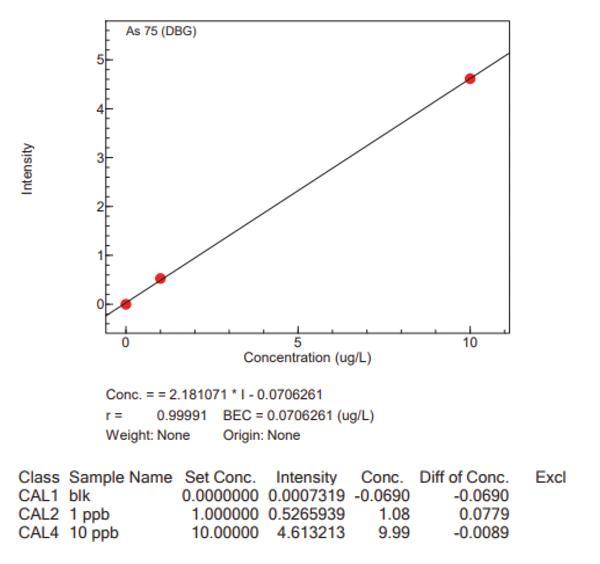
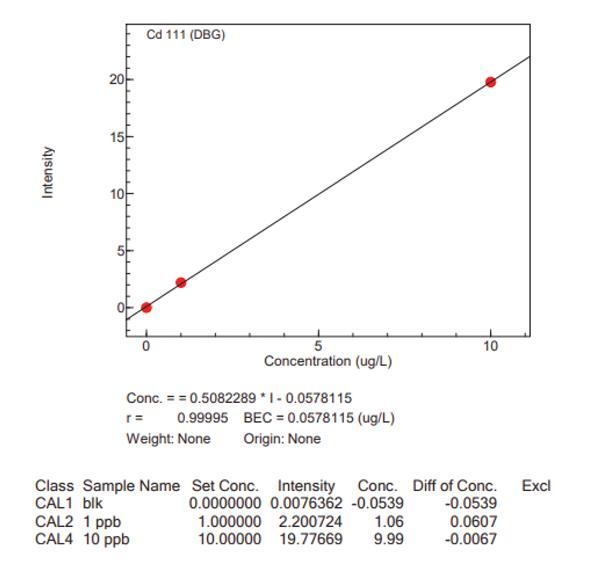
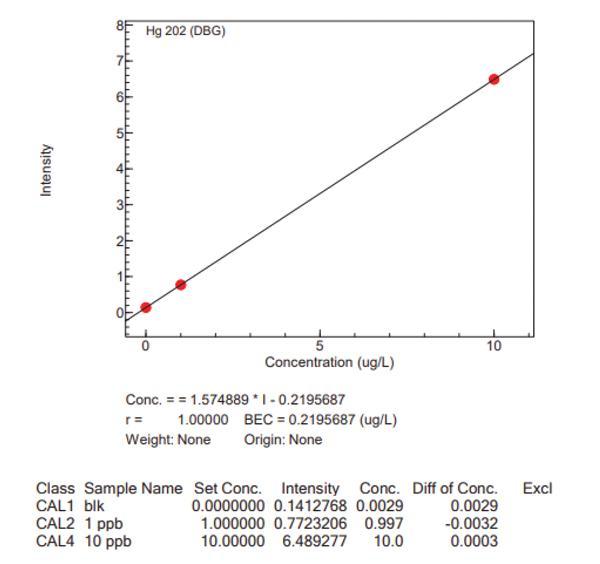
Calibration and check standards were created at concentrations typically used in the cannabis industry, and a method was generated for the analysis of the big four: As, Cd, Hg, and Pb. These values are given in Table 1. Internal standardization was accomplished for all standards, samples, and blanks automatically using the Glass Expansion Trident™ in-line addition kit. The analysis conditions were optimized for speed and accuracy, and these parameters are shown in Table 2. The analysis conditions were not changed when the Niagara was added, as the Niagara has no effect on the analysis portion of the sequence.